The equivalent to the pathping command on a Linux system is MTR.
What is the Linux command mtr?
MTR (MyTraceRoute) is a powerful network diagnostic tool. It combines the functionalities of ping and traceroute commands so that you can get the info you get with these two tools by using a single one. It’s already installed in most Linux distros like Ubuntu or Debian.
What does the mtr command do?
When you start the mtr command using for example a domain name as an argument:
mtr google.comMtr starts to send ping command with a low TTL, and registers the response time to get the latency of the host that hit the TTL.
Using increasing TTLs, MTR acts as traceroute, and builds the route from the host it runs on to the target hostname.
The link between ping and traceroute is in the fact that it offers an interface to view both the path, and some statistics about the response time of each host on the route.
Let’s start the command and see what the interface shows in the default report mode.
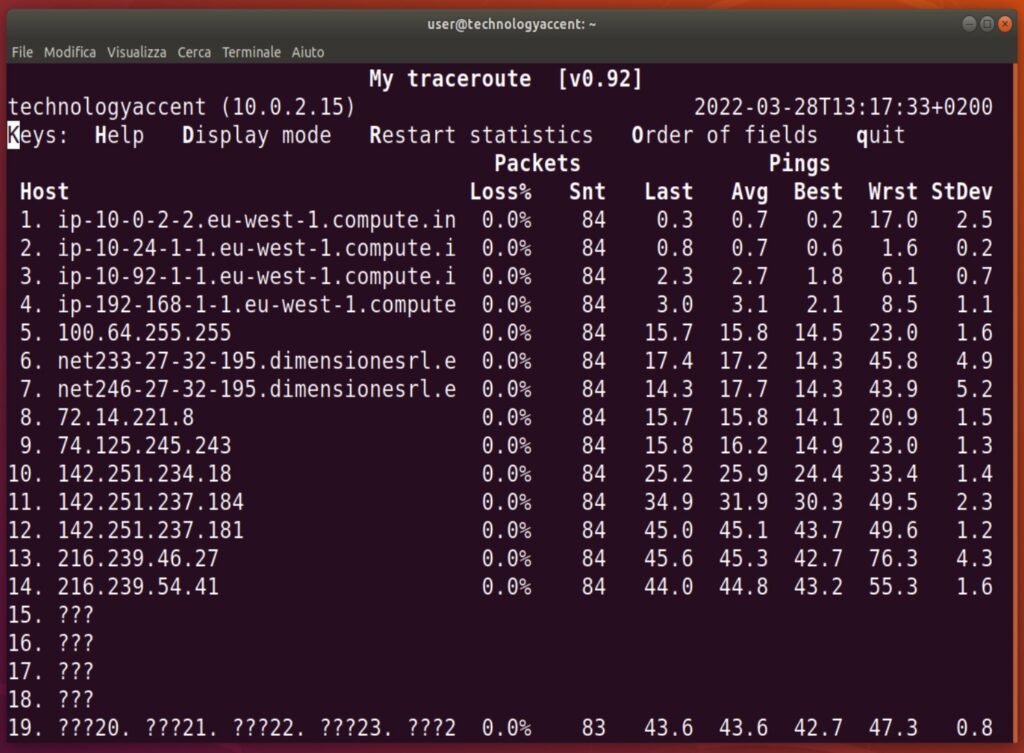
As we can see from this screenshot, the output is similar to a traceroute but contains some interesting data, let’s see what those fields mean:
- Host: The host that represents the step in the trace between you and the target hostname. The records are ordered so that the first is the nearest to you. You’ll see here the hostNames or the numeric IP addresses of the nodes.
- Packet – Loss %: This is the percentage of packet loss that occurred during the test. A 0 here means a 100% response percentage with no packet loss.
- Packet – Snt: The total count of outgoing packets that have been sent with that TTL.
- Last: This is the performance of the last ping to this node.
- Avg: This is the average latency of the node during the test.
- Best: In this field we can find the best latency for the hosts.
- Wrst: This column shows the worst round-trip time for each host.
- Stdev: This shows the standard deviation of the ping time.
With this simple command, you can get some info about the network performance, for example by noting big gaps in the average response time between a host and the following one. This can be due to a connectivity issue between those hosts or too much traffic between them.
The command by default keeps running, sending a set of packets every second, you can stop it with a <Ctrl> + c.
Which are the most useful mtr command line options?
the mtr command, like many other diagnostic tools, has a long list of options you can add to it to personalize the way it gets executed. We will try to briefly explain the most interesting one, you can find the full list on the mtr man page in your terminal or online.
Limiting the number of pings for each host
You can use the -c <number> option to limit the number of pings the mtr command will sent to each host. This is helpful if you want to make a test with an exact number of attempts and export the data, maybe to make a comparison between different source or target hosts or during different times of the day.
An example could be:
mtr -c 10 technologyaccent.comAvoid cutting hostnames
The standard command truncates an address if it’s too long. Using the -w option avoids this so you can get full hostnames.
You can change the output mode to various file formats for easier to automatic analysis.
There are a couple of options to export the results into automatically processable files. The main ones are:
- You can use -x or -xml to get an xml
- Use the -l or –raw for a raw output format.
- Use the -C Option to export data in csv format.
- If you use -j you’ll get a json output.
Specify a custom set of fields to display
You can specify a custom set of fields, you can use them to better assess network connectivity issues, for example to see if a problem is caused by some jitter introduced by a specific node.
To use your custom set of fields, you have to use the -o <fields> option. Here’s a list of some available fields, for an updated version always refer to the man page.
| Flag | Description |
| L | Loss ratio |
| D | Dropped packets |
| R | Received packets |
| S | Sent packets |
| N | Newest RTT(ms) |
| B | Min/Best RTT(ms) |
| A | Average RTT(ms) |
| W | Max/Worst RTT(ms) |
| V | Standard Deviation |
| G | Geometric Mean |
| J | Current Jitter |
| M | Jitter Mean/Avg. |
| X | Worst Jitter |
| I | Interarrival Jitter |
Just to make an example, you can create something like:
mtr -o "LSD A MX" google.com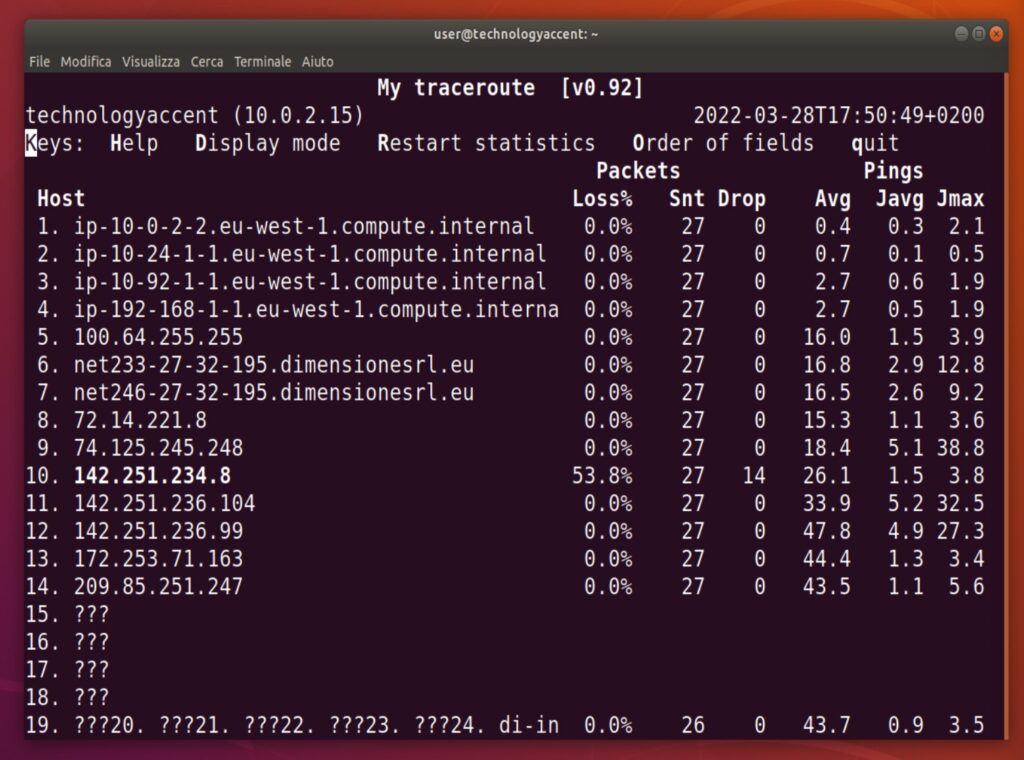
Specify the interval between iterations
You can use the -i seconds or –interval seconds option to specify the interval between the test packets, the default is every 1 second.
mtr -i 3 technologyaccent.comChange the Packet size
You can define the packet size used to probe the hosts with the -s <packetsize> option.
Packet size is expressed in bytes, and includes IP and ICMP headers.
Use a different protocol
By default, mtr uses standard ICMP packets to probe the hosts. With -u or –udp you can change that to use UDP packets, and with -T or –tcp you can tell mtr to use TCP SYN packets. These options can be a solution if a remote host is discarding ICMP traffic.
FAQ:
Is there a front-end for MTR in linux?
There seems to be one, you can get some further information from the mtr-web github page.
What is the difference between traceroute and MTR?
The main difference is that MTR combines traceroute with ping, so you get a traceroute with some additional ping info from all the hosts in the path.
How do I download MTR in Linux?
The MTR command is included by default in most distros, and when you don’t find it, you can usually get it from the repositories, using for example apt-get install mtr.
How do I run an MTR test in Linux?
The easiest way to run a MTR test is by using the default configuration, so with mtr followed by the host or ip address to target. (for example: mtr technologyaccent.com).
What is MTR last?
The “Last” field is the round-trip time of the last ping sent to the specified host.
Which port does MTR use?
ICMP relates to the Internet Layer, whereas port numbers relate to the Transport Layer. If you use the TCP or UDP protocols with the -T or -u ports, you can specify the port number with the -P <portnumber> option.