Recently, a friend and I were discussing the differences between Florida and California beaches. There were lots of differences. There were also some similarities that we agreed upon. In the end, we had formed two different opinions, but also gained some insight into the opposing opinion.
These kinds of discussions are common amongst so many people. We often give and share our opinions. For more official discussions of compare and contrast, a Venn diagram is an excellent tool for helping others to visualize similarities and differences.
Table of Contents
What is a Venn diagram?
First introduced in the 1880s by John Venn, the diagrams of the same name have made their way into many different areas of business, education, and popular culture. Venn diagrams are a great way to quickly convey the similarities and differences between sets of items or ideas. These simple diagrams are widely used in the study of logic, probabilities, and statistics, as well as in many other areas of education. Don’t let their simple design fool you, though, as they are often used to explain or bolster complex or abstract ideas and relationships.
What are the methods to make a Venn diagram?
In this article, we’ll be discussing how to create a Venn diagram in Google docs. To start, there are a few possible methods you can choose from.
- Google Docs – Using the drawing tool available in docs, you’ll be able to manually create a Venn diagram.
- Lucidchart add-on – Google docs allows other applications to be added to the Google Docs toolbar. Lucidchart offers built-in Venn diagram templates, as well as templates for charts, graphs, and other visual devices.
Making a Venn diagram with Google Drawings
To begin creating a Venn diagram in Google Docs, the user will want to become familiar with the toolbar at the top of the docs page. Many of the features and tools you’ll use are in this area.
Let’s see how to do it with some step-by-step instructions.
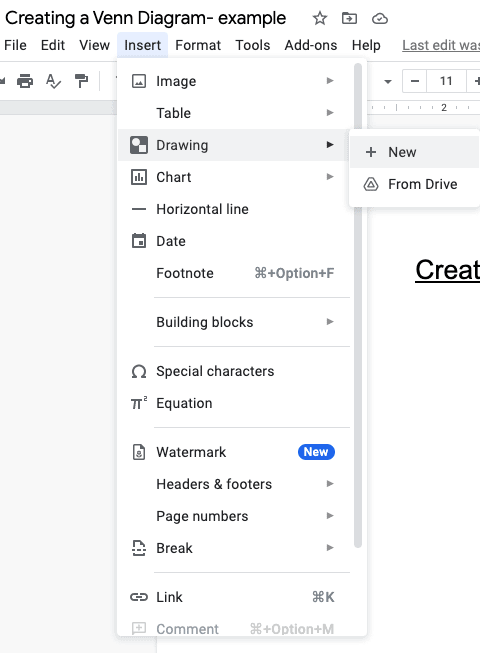
Step one- First, you’ll want to find the insert tab on the top toolbar. Click it and find the Drawing choice in the drop-down menu. When you click on Drawing, an option for New+ will appear. This is how you’ll make a new drawing and a new file.
Step two- Next, you’ll open up a drawing screen for creating new images. The drawing screen will also contain a toolbar for your function choices. Find the shape icon and click it. A new screen of shape choices will open up.
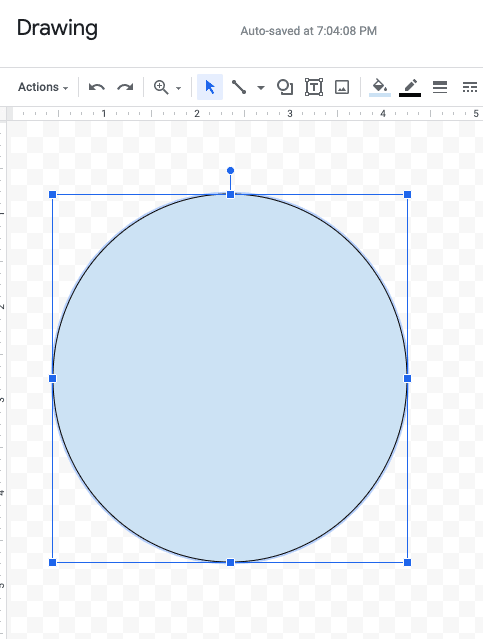
Step three- Once you’ve opened shapes, you’ll see lots of different shape choices. Look for the oval shape, as seen in the screenshot. Click the oval and a plus sign will appear.
Click and hold on to your draw prep screen as you move your cursor, and you’ll begin to draw a circle in the size and shape you want.
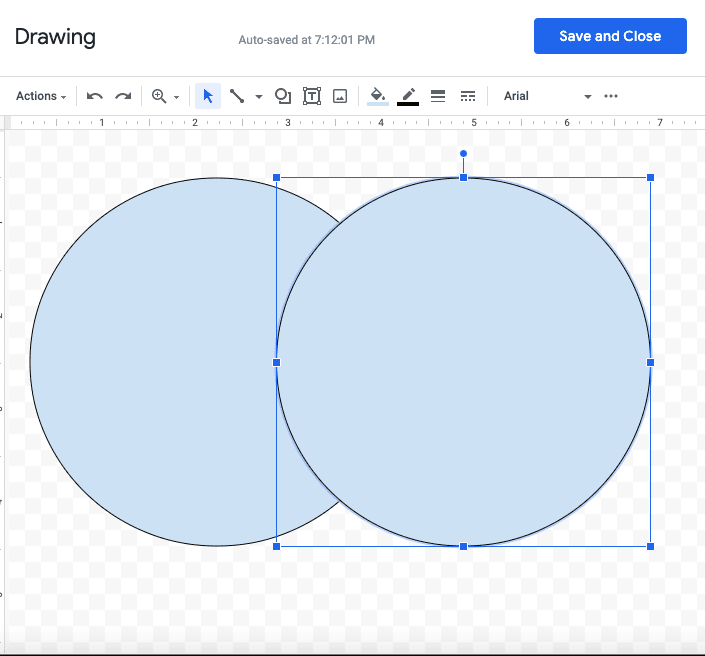
Step four- Now that you have one of your circles, you can move or size it, accordingly. Once you have one circle drawn and placed, copy the circle (command+C) and then paste it (command+V). You now have two circles for your Venn diagram.
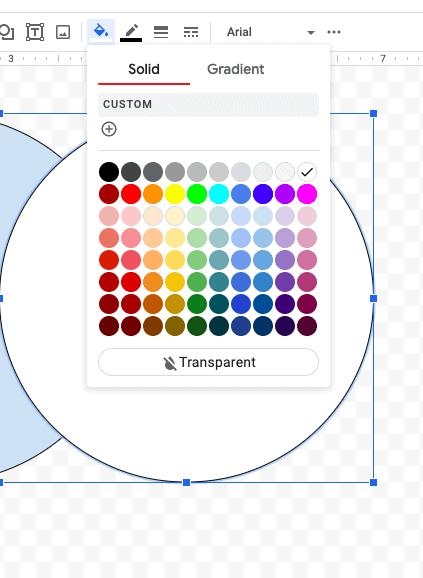
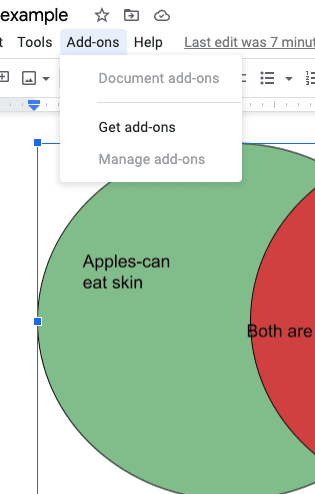
Step five- Since your diagram will represent at least two different sets for comparison/contrast, it’s recommended to color coordinate the two circles. You’ll also want to make sure the overlay comparison area is transparent. After clicking on one of your circles, choose the tab titled fill color.
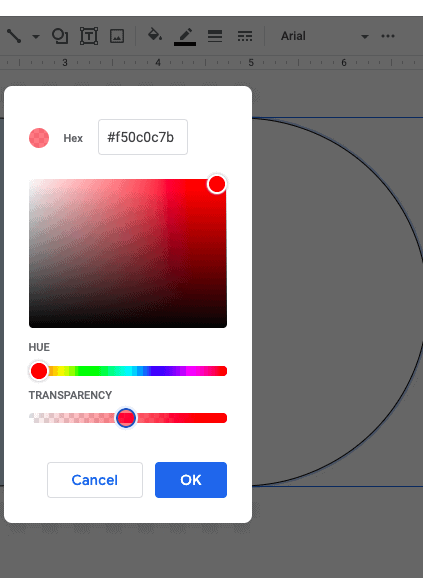
Once your color choices appear, you’ll want to click on the custom button.
On the custom screen, you’ll see parameters for the colors and hues you’re choosing, as well as a gradient slide tool for transparency. 50% is a good transparency setting.
Click on the other circle and follow the same steps for choosing a color. A different color helps to visualize the differences in the diagram.
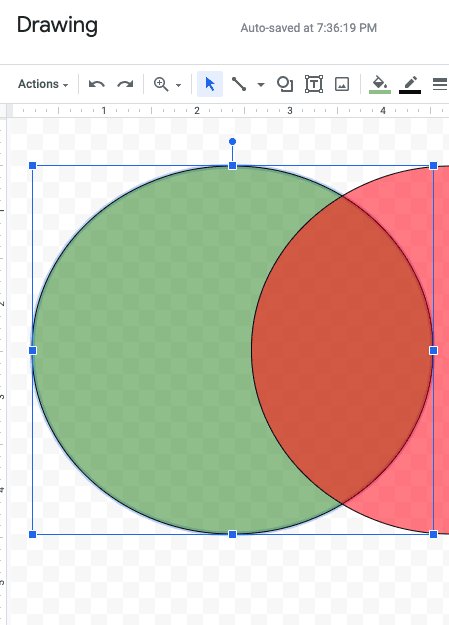
Once you’ve created your two circles, make sure to click the Save and Close button and you’ll be taken back to your document.
When you’re back on your document, you’ll still be able to adjust the size of your diagram by clicking and dragging on the blue line surrounding it. If you need to make more changes or add text, you can click the edit button and you’ll be taken back to the drawing edit screen.
When on the draw edit screen, you can add text or make more specific changes. Click the text box to add words to your diagram.
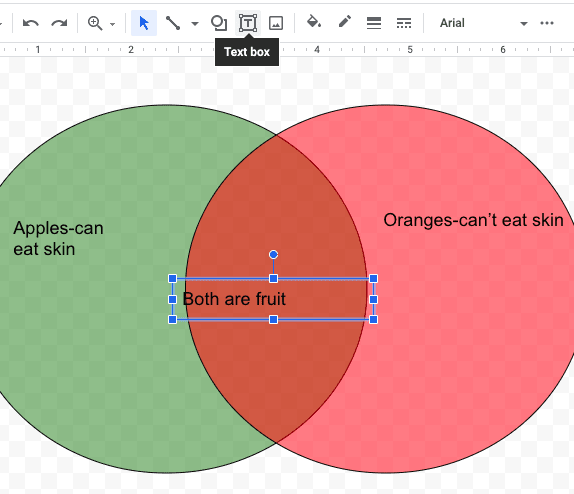
Once you’ve made your edits and added text, click save and close again and you’ll be back to the document page. Now you’ve created a Venn diagram in Google docs. It will be saved in your Google drive.
Making a Venn diagram with the Lucidchart add-on
If you need lots of different charts or graphs for your documents, you may want to consider an add-on feature like Lucidchart. Lucidchart diagrams work with Google docs to offer an intuitive solution with pre-designed templates for various different charts, graphs, and diagrams. The process is much simpler to make a Venn diagram and can save time, since you just pick a diagram template from the choices instead of having to design each diagram from scratch.
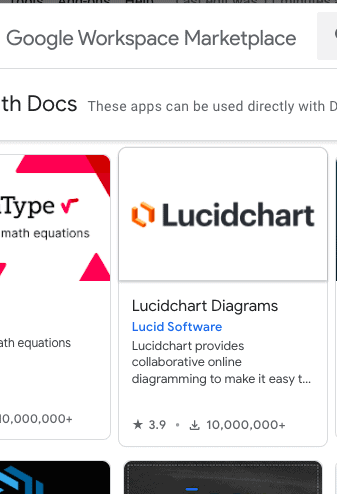
First, you’ll need to add Lucidchart to your Google docs toolbar. Find the add-ons drop down, click it, and then click “Get add-ons.” This will direct you to another screen on which you can purchase and download various types of add-on services for Google docs. You’ll see Lucidchart as a top choice, or you can find it using the search textbox you’ll find on the top of the Google Workspace Marketplace dialog box.
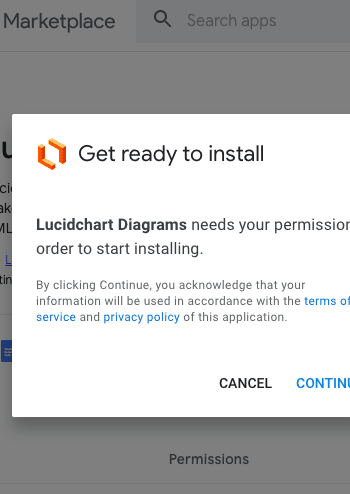
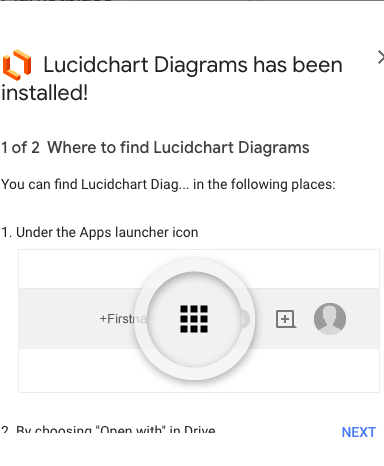
From here, follow the instructions to install Lucidchart with the browser of your choice. When completed, you’ll be given a location for this new set of tools.
You can find here a simple short (1:36) video by the Lucidchart support channel to guide you on the installation and basic features.
For more detailed info and a tutorial on how to actually design a Venn diagram using Lucidchart, you can watch this other video. The Lucidchart’s experts will guide you through the available functions to get the best from the add-on.
One big drawback to Lucidchart is the free vs. paid subscription options. With the free edition, you are limited in your usage per month. As you pay for subscription levels, your options will increase.
Another drawback is obviously that you have to install an add-on. Lucidchart seems a legit company with more than 10000000 downloads and it shows up in the “Most popular” section of the Google Workspace Marketplace, but you can be hesitant to install add-ons, or your company’s security/privacy policies could prevent you to install an external tool without authorization.
Conclusions
To wrap things up, we can say that making a Venn diagram in Google Docs, whether you chose to go through the Google Drawings method or use a diagram maker add-on, is not a difficult task.
You can get things done quick and easy with the Google Drawings method if you do it once in a while, but going the add-on route could be better if you use a lot of diagrams.